Python
fromdeath and gravity
1 day agoreader 3.22 released - new web app
Version 3.22 of reader introduces a new web app with enhanced features and a unified configuration system.
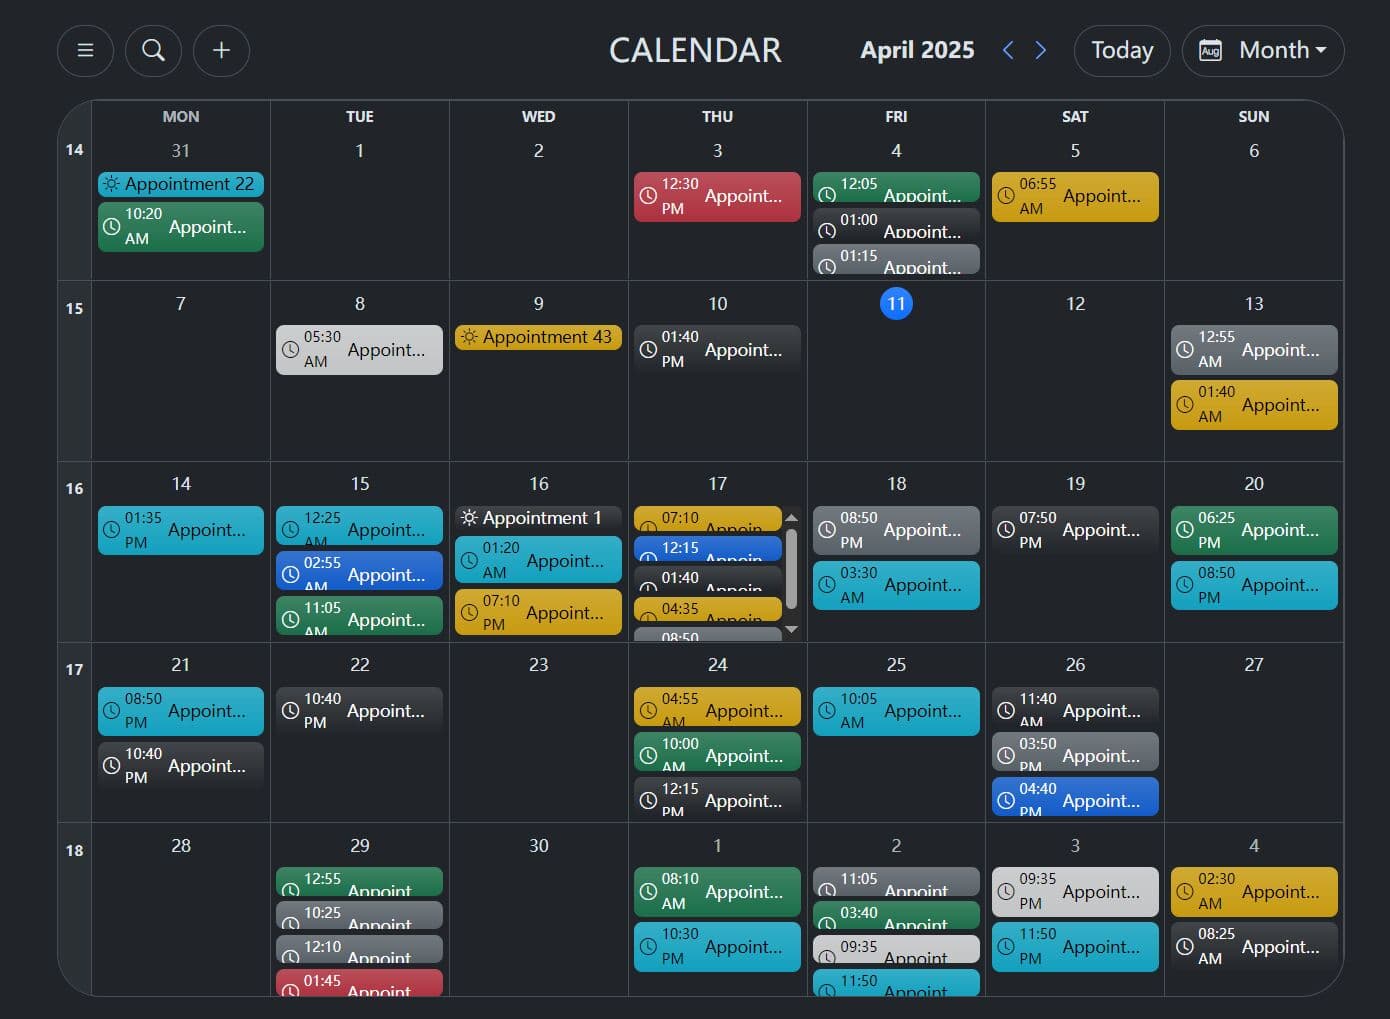
Digital wall calendars take your online calendar-think your Google Calendar, the Calendar app on your iPhone, or your corporate Microsoft calendar account-and put it on a digital screen that you can mount on the wall or prop up on a stand on a countertop or table.
Performance is a critical factor in user engagement, where even minor delays in loading can deter users. A clean and simple user interface also contributes significantly to user retention.
One of the reasons I've been digging Astro so much is that it nicely straddles the SSG world and Node.js server worlds. When building your app, you can make logical decisions about what should be done at build time versus what should be done dynamically. It's like having Express and Eleventy rolled into one solution.
A financial analyst can pull comparable company financials from an open workbook and other data sources. From there they could build out a trading comps table in Excel, drop the valuation summary into the pitch deck, and draft the email to the MD - without switching tabs or re-explaining the dataset at each step.
Modern web applications are no longer just "sites." They are long-lived, highly interactive systems that span multiple runtimes, global content delivery networks, edge caches, background workers, and increasingly complex data pipelines. They are expected to load instantly, remain responsive under poor network conditions, and degrade gracefully when something goes wrong.
The component also provides features for columns (sort, hide, resize), rows (select), cells (keyboard navigation, pointer interactions, custom rendering). Feel free to ask and look at the code if you're interested in knowing more. The <HighTable> component is developed at hyparam/hightable. It was created by Kenny Daniel for Hyperparam, and I've had the chance to contribute to its development for one year now.
TidalSense is a respiratory technology company with a mission to transform the diagnosis, monitoring and management of chronic respiratory conditions, such as asthma and COPD. The company has ambitions to enable a population-scale change in respiratory care through global deployment of its technologies. TidalSense has just launched a first-of-its-kind AI-driven (software medical device) diagnostic test for COPD which uses the company's unique, patented, sensor technology embedded in the N-Tidal device.
Most beginner data portfolios look similar. They include: A few cleaned datasets Some charts or dashboards A notebook with code and commentary Again, nothing here is wrong. But hiring teams don't review portfolios to check whether you can follow instructions. They review them to see whether you can think like a data analyst. When projects feel generic, reviewers are left guessing:
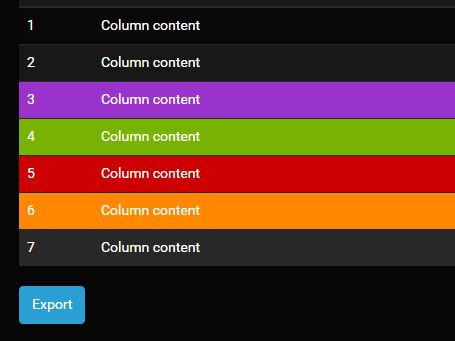
Completely free and open source (view our licence here). data_object Supports export for integration with frameworks including React, Vue, and Angular. Fully configurable, featuring custom triggers and adjustable text to support multiple language locales. 60 languages supported by default (view the languages here). Includes multiple views, including Map, Line, Chart, Days, Months, and Color Ranges. export_notes Export data to multiple file formats (view the supported types here), with system clipboard setting support.
Claude is a very powerful AI tool that works especially well for coding. It's possible to code entire applications or services in Claude. That's why Claude quickly becomes a very important tool in a product designer's toolkit. It allows us to move quickly and build not only fast interactive prototypes, but also code UI components ready for implementation. To make this guide more specific, I will use Claude to code a sign-up web form.
Frontends are no longer written only for humans. AI tools now actively work inside our codebases. They generate components, suggest refactors, and extend functionality through agents embedded in IDEs like Cursor and Antigravity. These tools aren't just assistants. They participate in development, and they amplify whatever your architecture already gets right or wrong. When boundaries are unclear, AI introduces inconsistencies that compound over time, turning small flaws into brittle systems with real maintenance costs.
Good morning, programs! Today I'm sharing yet another example of Chrome's on-device AI features, this time to demonstrate a "Bluesky Sentiment Dashboard". In other words, a tool that lets you enter terms and then get a report on the average sentiment for posts using that word. I actually did this before (and yes, I forgot until about a minute ago) last year using Transformers.js: Building a Bluesky AI Sentiment Analysis Dashboard.
When it comes to working with data in a tabular form, most people reach for a spreadsheet. That's not a bad choice: Microsoft Excel and similar programs are familiar and loaded with functionality for massaging tables of data. But what if you want more control, precision, and power than Excel alone delivers? In that case, the open source Pandas library for Python might be what you are looking for.
This same sense of uncertainty can be triggered in software products. Many digital experiences consist of background tasks, file imports, system updates, and other long-running processes that run quietly and invisibly, leaving users with no indications of progress or feedback. The user initiates an action, like a sync, a publish, or a bulk update, and is responsible for the outcome, while the system does all the work out of sight.
Every year, poor communication and siloed data bleed companies of productivity and profit. Research shows U.S. businesses lose up to $1.2 trillion annually to ineffective communication, that's about $12,506 per employee per year. This stems from breakdowns that waste an average of 7.47 hours per employee each week on miscommunications. The damage isn't only interpersonal; it's structural. Disconnected and fragmented data systems mean that employees spend around 12 hours per week just searching for information trapped in those silos.
The more attributes you add to your metrics, the more complex and valuable questions you can answer. Every additional attribute provides a new dimension for analysis and troubleshooting. For instance, adding an infrastructure attribute, such as region can help you determine if a performance issue is isolated to a specific geographic area or is widespread. Similarly, adding business context, like a store location attribute for an e-commerce platform, allows you to understand if an issue is specific to a particular set of stores
The web is full of AI assistants that appear to understand application UIs, user data, and intent. In practice, however, most of these systems operate outside the application itself. When you try to build one from scratch, you quickly run into a core limitation: large language models have no native understanding of your React state, component hierarchy, or business logic.
CSS Grid Lanes adds a whole new capability to CSS Grid. It lets you line up content in either columns or rows - and not both. This layout pattern allows content of various aspect ratios to pack together. No longer do you need to truncate content artificially to make it fit. Plus, the content that's earlier in the HTML gets grouped together towards the start of the container. If new items get lazy loaded, they appear at the end without reshuffling what's already on screen.